Feature Engineering: deriving statistical features using pandas aggregate function
Table of Contents
Many times when dealing with anonymized or machine-generated datasets, you find yourself out of ideas to come up with new features because it is unclear of what the dataset variables at hand represent. Take for example the following dataframe:
| |
| absorbance0 | absorbance1 | absorbance2 | absorbance3 | absorbance4 | absorbance5 | absorbance6 | absorbance7 | absorbance8 | absorbance9 | absorbance10 | |
|---|---|---|---|---|---|---|---|---|---|---|---|
| 0 | 0.517951 | 0.520508 | 0.526852 | 0.531611 | 0.536816 | 0.543828 | 0.547761 | 0.554379 | 0.565622 | 0.575762 | 0.590253 |
| 1 | 0.517839 | 0.522367 | 0.525186 | 0.534661 | 0.541900 | 0.546180 | 0.551687 | 0.556753 | 0.566446 | 0.578208 | 0.591039 |
| 2 | 0.517702 | 0.522018 | 0.527237 | 0.534374 | 0.541155 | 0.547152 | 0.549837 | 0.557513 | 0.566793 | 0.580574 | 0.592258 |
| 3 | 0.525008 | 0.527439 | 0.536871 | 0.539636 | 0.546555 | 0.553183 | 0.558826 | 0.563549 | 0.575675 | 0.587214 | 0.597155 |
| 4 | 0.520532 | 0.522683 | 0.526842 | 0.534634 | 0.539676 | 0.547488 | 0.552688 | 0.558355 | 0.568959 | 0.578905 | 0.591207 |
| 5 | 0.526705 | 0.532114 | 0.536730 | 0.541363 | 0.549652 | 0.553074 | 0.558868 | 0.564017 | 0.576104 | 0.583493 | 0.598938 |
| 6 | 0.520870 | 0.531424 | 0.534101 | 0.538626 | 0.543272 | 0.551315 | 0.555033 | 0.563571 | 0.571861 | 0.583686 | 0.596506 |
| 7 | 0.527200 | 0.525328 | 0.532838 | 0.537154 | 0.543959 | 0.549961 | 0.557294 | 0.559478 | 0.572084 | 0.584293 | 0.597304 |
| 8 | 0.525830 | 0.532805 | 0.535670 | 0.539697 | 0.546112 | 0.551254 | 0.556557 | 0.564790 | 0.575007 | 0.583733 | 0.598626 |
| 9 | 0.533108 | 0.530202 | 0.537924 | 0.540190 | 0.548308 | 0.553694 | 0.558700 | 0.562952 | 0.574196 | 0.584925 | 0.597308 |
This data is most probably machine generated, that is true because what we’re seeing here is 10 rows of blood spectroscopy readings. (There are well over 150 absorbance columns but since our focus is on generating features let’s just work with these 11 columns.)
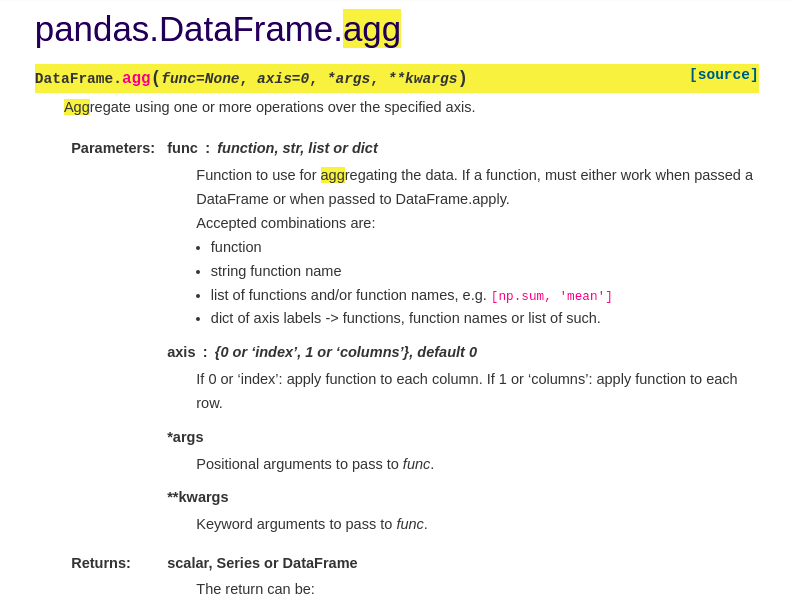
We can use pandas aggregate function to map various statistical measures such as mean, median, variance etc of our data to come up with more features that can aid in improving our machine learning model performance when using this data in modeling a possible solution to the problem at hand. The modeling bit aside, for now let’s dive straight to designing our extra features.
The various statistical measures we’re going to aggregate are:
- mean
- median
- sum
- count
- max
- min
- standard deviation
- variance
- skewness
- kurtosis
Let’s quickly wrap them all up in a loop:
| |
Dataframe before adding aggregate features:
| absorbance0 | absorbance1 | absorbance2 | absorbance3 | absorbance4 | absorbance5 | absorbance6 | absorbance7 | absorbance8 | absorbance9 | absorbance10 | |
|---|---|---|---|---|---|---|---|---|---|---|---|
| 0 | 0.517951 | 0.520508 | 0.526852 | 0.531611 | 0.536816 | 0.543828 | 0.547761 | 0.554379 | 0.565622 | 0.575762 | 0.590253 |
| 1 | 0.517839 | 0.522367 | 0.525186 | 0.534661 | 0.541900 | 0.546180 | 0.551687 | 0.556753 | 0.566446 | 0.578208 | 0.591039 |
| 2 | 0.517702 | 0.522018 | 0.527237 | 0.534374 | 0.541155 | 0.547152 | 0.549837 | 0.557513 | 0.566793 | 0.580574 | 0.592258 |
Dataframe after adding aggregate features:
| absorbance0 | absorbance1 | absorbance2 | absorbance3 | absorbance4 | absorbance5 | absorbance6 | absorbance7 | absorbance8 | absorbance9 | ... | agg_mean | agg_median | agg_sum | agg_count | agg_max | agg_min | agg_std | agg_var | agg_skew | agg_kurt | |
|---|---|---|---|---|---|---|---|---|---|---|---|---|---|---|---|---|---|---|---|---|---|
| 0 | 0.517951 | 0.520508 | 0.526852 | 0.531611 | 0.536816 | 0.543828 | 0.547761 | 0.554379 | 0.565622 | 0.575762 | ... | 0.546486 | 0.543828 | 6.011343 | 11 | 0.590253 | 0.517951 | 0.023236 | 0.000540 | 0.622384 | -0.477046 |
| 1 | 0.517839 | 0.522367 | 0.525186 | 0.534661 | 0.541900 | 0.546180 | 0.551687 | 0.556753 | 0.566446 | 0.578208 | ... | 0.548388 | 0.546180 | 6.032264 | 11 | 0.591039 | 0.517839 | 0.023451 | 0.000550 | 0.465583 | -0.609624 |
| 2 | 0.517702 | 0.522018 | 0.527237 | 0.534374 | 0.541155 | 0.547152 | 0.549837 | 0.557513 | 0.566793 | 0.580574 | ... | 0.548783 | 0.547152 | 6.036613 | 11 | 0.592258 | 0.517702 | 0.023911 | 0.000572 | 0.520019 | -0.569977 |
3 rows × 21 columns
Quick and efficient! We have added ten more features to our dataset.
Other function names that can be passed to pandas aggregate function are listed in the documentation here. Note however that not all of them return a pandas series (column).