
Why datastand? Data + Understand
A python package to help Data Scientists, Machine Learning Engineers and Analysts better understand data. Gives quick insights about a given dataset:
- general dataset statistics
- size and shape of dataset
- number of unique data types
- number of numerical and non- numerical columns
- small overview of dataset
- missing data statistics
- missing data heatmap and
- provides methodology to impute missing data
Installation
Run the following command on the terminal to install the package:
Usage
Importing and using datastand
1
2
3
4
5
6
| from datastand.datastand import datastand
import pandas as pd
df = pd.read_csv("path/to/target/dataframe")
datastand(df)
|
Calling datastand on the given dataset gives the following output:
 1
 2
 3
 4
 5
 6
 7
 8
 9
10
11
12
13
14
15
16
17
18
19
20
21
22
23
24
25
26
27
28
29
30
31
32
33
34
35
36
37
38
39
40
41
42
43
44
45
46
47
48
49
50
51
52
53
|
General stats:
______________
Size of DataFrame: 309200
Shape of DataFrame: (3865, 80)
Number of unique data types : {dtype('int64'), dtype('O'), dtype('float64')}
Number of numerical columns: 79
Number of non-numerical columns: 1

Head of DataFrame:
__________________
   galactic year                        galaxy  existence expectancy index  ...  Private galaxy capital flows (% of GGP)  Gender Inequality Index (GII)         y
0         990025  Large Magellanic Cloud (LMC)                    0.628657  ...                                      NaN                            NaN  0.052590
1         990025              Camelopardalis B                    0.818082  ...                                22.785018                            NaN  0.059868
2         990025                       Virgo I                    0.659443  ...                                      NaN                            NaN  0.050449
3         990025            UGC 8651 (DDO 181)                    0.555862  ...                                      NaN                            NaN  0.049394
4         990025                  Tucana Dwarf                    0.991196  ...                                      NaN                            NaN  0.154247

[5 rows x 80 columns]

Tail of DataFrame:
__________________
      galactic year                        galaxy  existence expectancy index  ...  Private galaxy capital flows (% of GGP)  Gender Inequality Index (GII)         y
3860        1015056                     Columba I                    1.029704  ...                                29.294865                       0.580785  0.042324
3861        1015056  Leo II Dwarf (Leo B, DDO 93)                    0.937869  ...                                31.085400                       0.517558  0.036725
3862        1015056        Canes Venatici I Dwarf                    1.036144  ...                                32.145570                       0.363862  0.166271
3863        1015056                         KKs 3                    0.939034  ...                                27.227179                       0.711878  0.024187
3864        1015056                      NGC 5237                    1.032244  ...                                29.957851                       0.583706  0.100069

[5 rows x 80 columns]

Missing data:
=======================
DataFrame contains 185698 missing values(60.06%) as follows column-wise:
-----------------------------------------------------------------------
galactic year                                                                   0
galaxy                                                                          0
existence expectancy index                                                      1
existence expectancy at birth                                                   1
Gross income per capita                                                        28
                                                                             ...
Adjusted net savings                                                         2953
Creature Immunodeficiency Disease prevalence, adult (% ages 15-49), total    2924
Private galaxy capital flows (% of GGP)                                      2991
Gender Inequality Index (GII)                                                3021
y                                                                               0
Length: 80, dtype: int64
-----------------------------------------------------------------------

Do you wish to long-list missing data statistics?(y/n): y
.
.
.
|
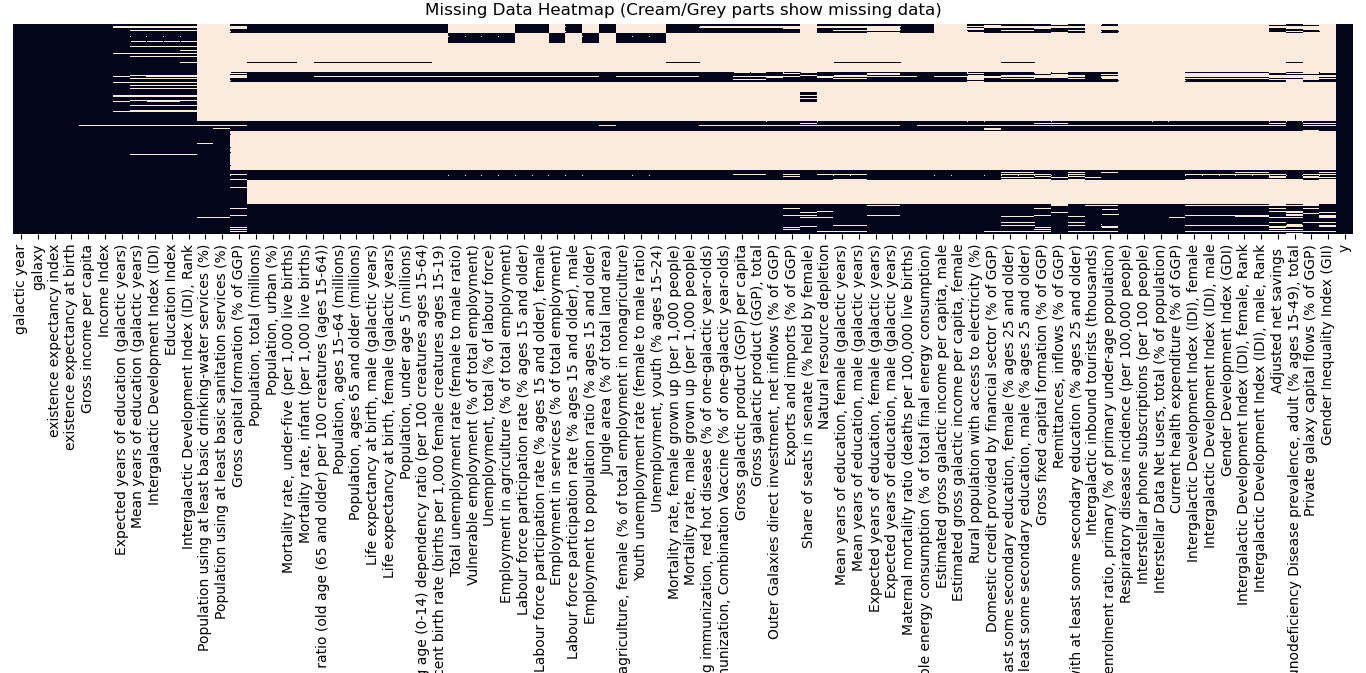
Missing data heatmap
To plot a heatmap to visualize missing data statistics, we import a function plot_missing:
1
2
3
4
5
| # This function is already available in the DataStand class and also available separately
# Here we're running it separately
from datastand.datastand import plot_missing
plot_missing(df)
|
Data imputation
Datastand offers data imputation methodologies using the following strategies:
- For numerical columns: fill missing value with a random value chosen from:
- np.arange(min value in the column, max_value, standard deviation of the column)
- For categorical columns:
- fill with a constant value (method 1)
- fill with a value chosen from the already existing categories at random
This way we ensure we maintain the trend of data in that particular column.
NOTE: We impute only columns with less than half missing data points of the total length of the column
1
2
3
| from datastand.datastand import impute_missing
impute_missing(df)
|
Output:
1
2
3
| Imputing missing data...
100%|████████████████████████████████████████████████████████████████████████████████████████████████████████████████████████████████████| 80/80 [00:02<00:00, 30.52it/s]
Imputation complete.
|